Si: 3D Bulk Unfolding
In this section, we unfold silicon phonon bands from a 2x2x2 supercell back to the primitive cell.
The full script is available at examples/unfold_si_bulk.py.
The forces come from a DFT calculation with FHI-aims and are available at tests/data/si.
The following code snippets come from the full script.
Preparing inputs
unPHold only needs a Phonopy object of the supercell (usually reloaded from a phonopy.yaml file) with its force constants as input.
See this tutorial for a complete phonopy workflow in Python.
Load supercell runs with primitive_matrix='P'
Phonopy builds the dynamical matrix and the eigenvectors on ph.primitive, not on the input cell ph.unitcell.
Since phonopy v4, phonopy.load defaults to primitive_matrix="auto" instead of the previous "P" (the identity).
Phonopy would then reduce the 2x2x2 supercell here back to the 2-atom primitive cell,
and the eigenvectors would no longer match the supercell geometry taken from ph.unitcell.
Pass primitive_matrix="P" (the identity) when loading a supercell run for unfolding, as done in the full script.
We have prepared the 2x2x2 supercell data (tests/data/si/uc_2_sc_1_aims/) for unfolding, as well as the primitive cell data (tests/data/si/uc_1_sc_2_aims/) for reference.
Since their supercells for constructing force constants by finite difference are the same, the unfolded supercell phonon bands should match the primitive cell bands exactly.
We can load the above data and plot the phonon bands for both the primitive cell and the supercell:


K-point path
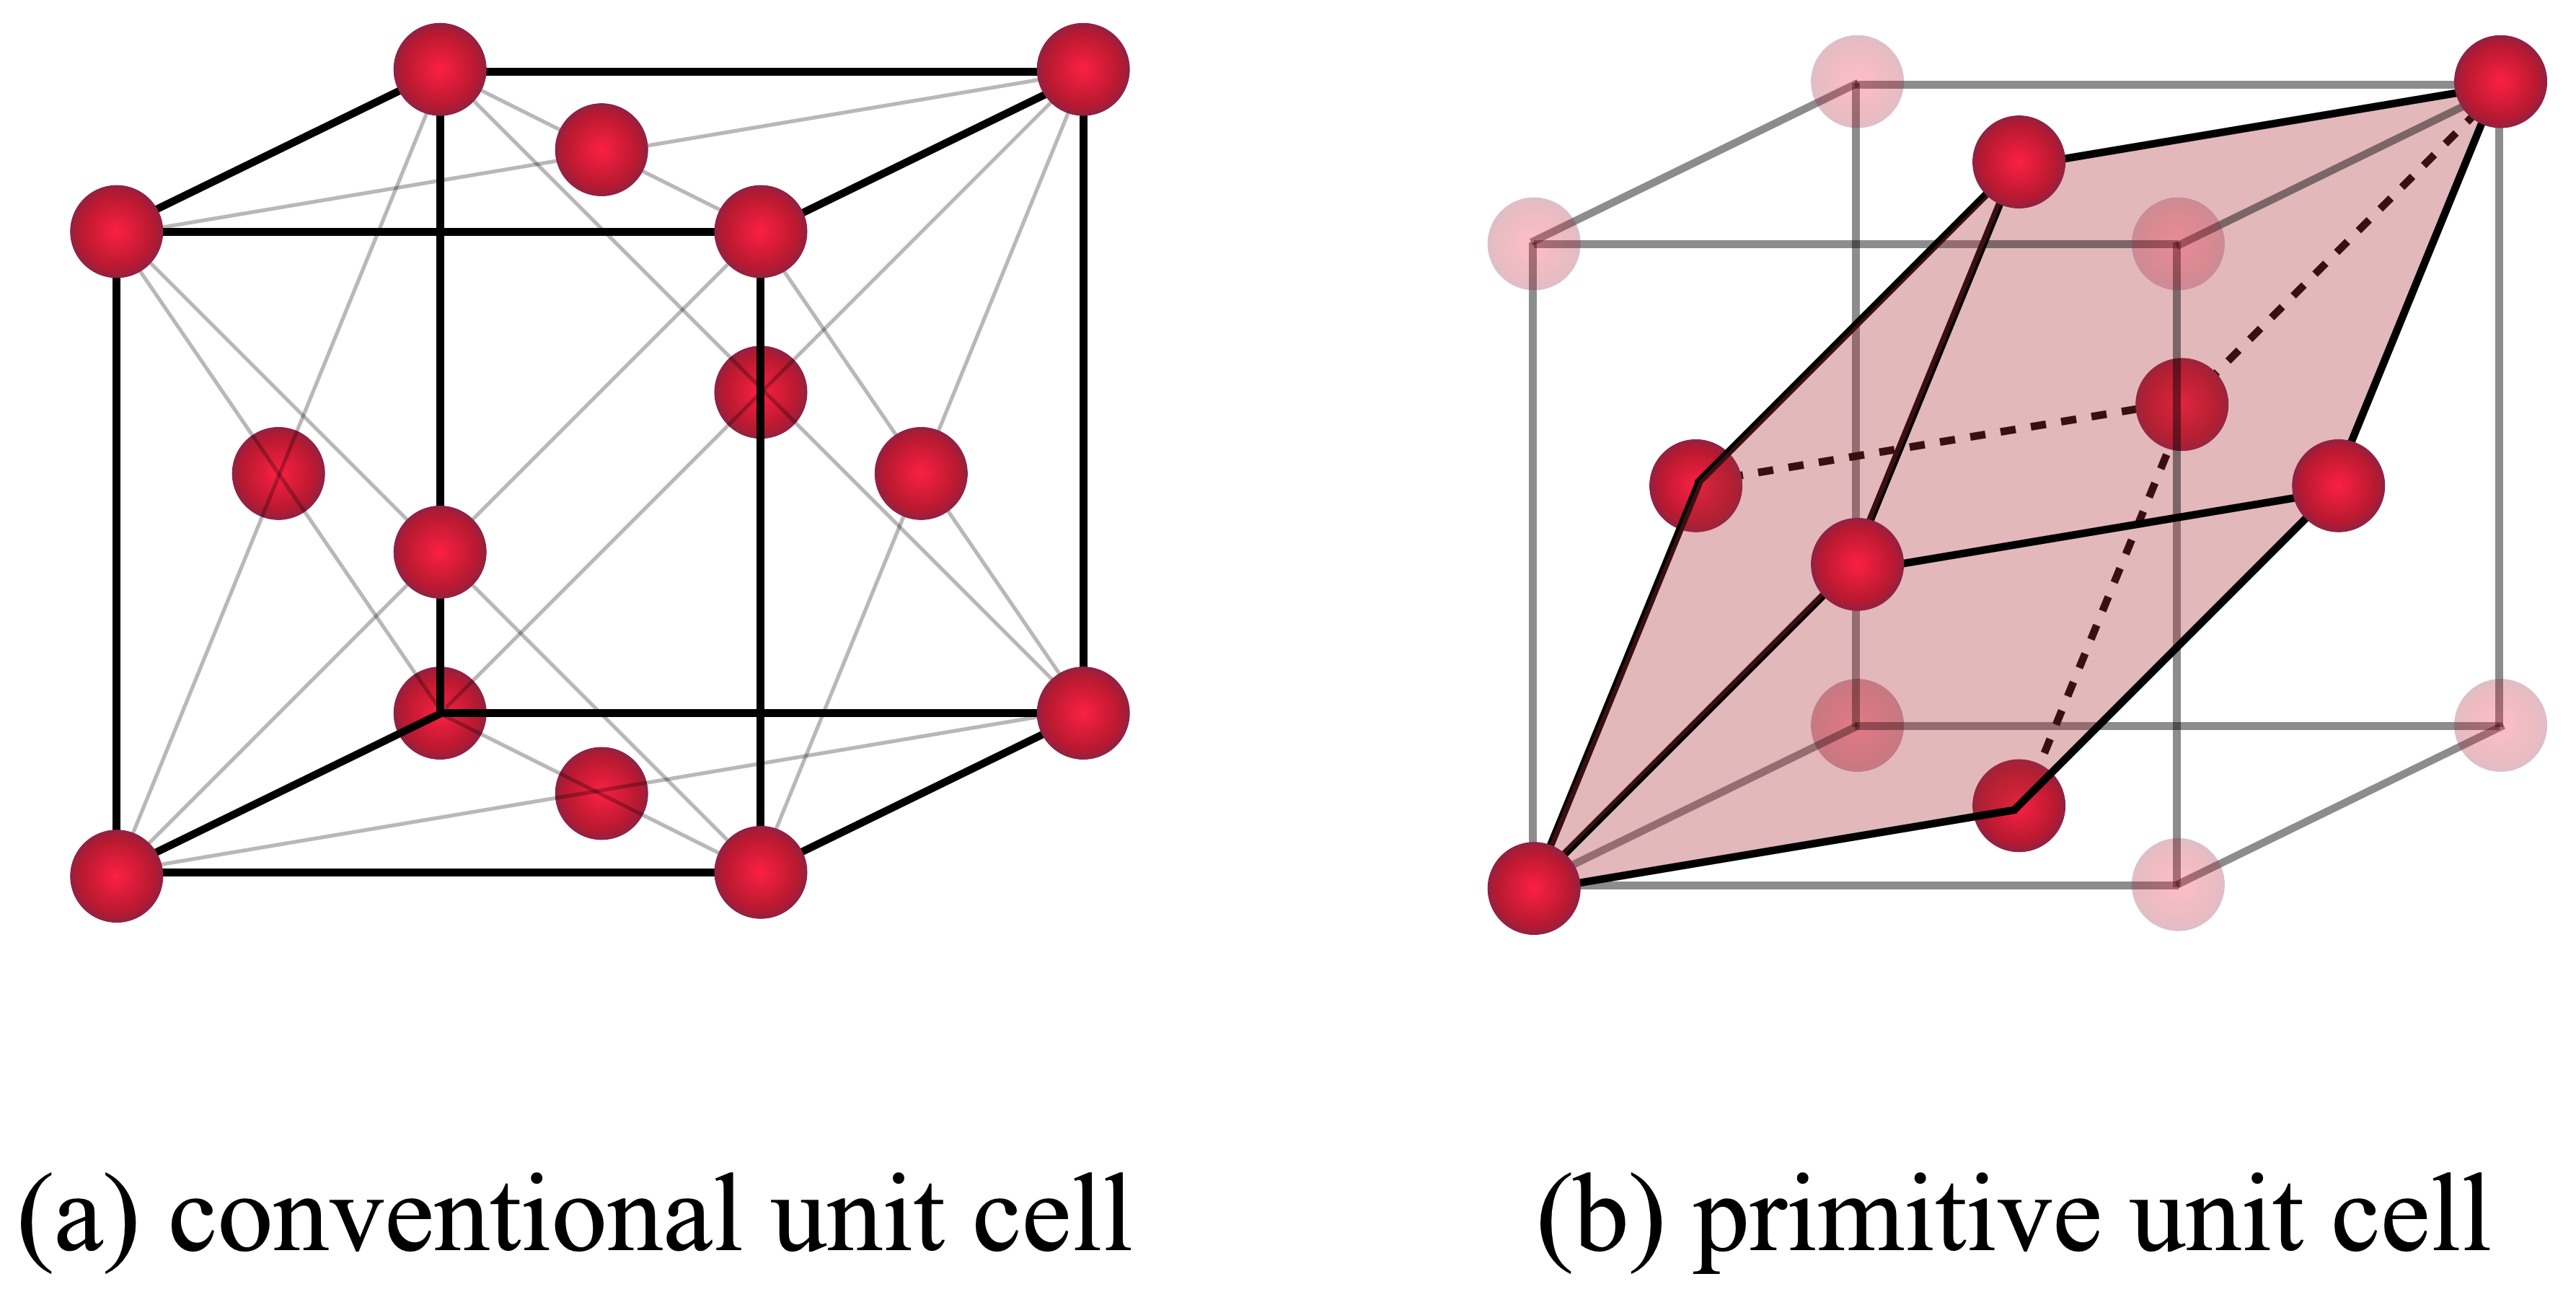
The standard high-symmetry points for FCC are:

We use the k-path Γ-X-U|K-Γ-L in the primitive cell BZ.
A supercell built by repeating the primitive cell is described by an integer transformation matrix TMAT, where supercell_vectors = TMAT @ unitcell_vectors.
For our 2x2x2 supercell, TMAT = diag([2, 2, 2]).
This same matrix maps a k-point's fractional coordinates from the primitive-cell BZ to the (larger) supercell BZ, letting us evaluate the supercell phonons at the k-points we care about:
kpts_uc, connections = get_band_qpoints_and_path_connections(KPATH, npoints=51)
kpts_flat, bz_idx = concatenate_bands(kpts_uc, connections)
kpts_sc = [k @ TMAT.T for k in kpts_uc]
kpts_flat has shape (nkpts, 3): Unfold consumes a single flat array of k-points rather than phonopy's per-segment path format, since it evaluates every k-point independently.
kpts_sc is the same set of k-points expressed in the supercell BZ, used to compute the supercell reference bands shown above.
We keep kpts_uc and connections around to recover high-symmetry tick marks and reformat the unfolding output into the standard phonopy band format for plotting; see the full script for details.
Running the unfolding
unfold = Unfold(
    unitcell=atoms_ph2ase(ph_uc.unitcell),
    supercell=atoms_ph2ase(ph_sc.unitcell),
    transformation_matrix=TMAT,
    verbose=True,
)
unfold.set_kpts_in_unitcell(kpts_flat, format="fractional")
unfold.calculate_sc_phonon(dyn_sc=ph_sc.dynamical_matrix, factor="thz")
unfold.calculate_weights()
Unfold.calculate_sc_phonon() diagonalises the supercell dynamical matrix at each k-point.
Unfold.calculate_weights() projects each SC eigenvector onto the primitive-cell space, yielding unfold.weights of shape (nkpts, n_sc_modes).
Validating unfolded phonon bands
To validate the unfolding weights, we can apply a Gaussian expansion to the unfolded weights along the frequency axis and plot the unfolded spectral function:
spectral, grid, sigma = unfold.calculate_spectral_function_on_grid()The unfolded spectral function spectral (shape (nkpts, ngrid)) recovers the primitive-cell dispersion:


The unfolded spectral function overlaps exactly with the primitive-cell bands (left) while picking out only a subset of the folded supercell bands (right). A supercell calculation folds all primitive-cell bands on top of each other in a smaller Brillouin zone; unfolding undoes this and recovers the primitive-cell dispersion directly from the supercell calculation.
This Si example is a proof of concept: primitive and supercell here come from the same finite-difference calculation, so the match is exact by construction. The same machinery extends to cases a primitive-cell calculation cannot reach: twisted bilayers with no shared periodicity, deregistered (relaxed) twisted structures, and defect-containing supercells, where unfolding becomes essential to recover a meaningful band structure.